All components
Marketing sections, AI pieces, charts, interactives, backgrounds and text effects. Preview live, copy when you’re signed in.
4 results for “heatmap”
4 results for “heatmap”
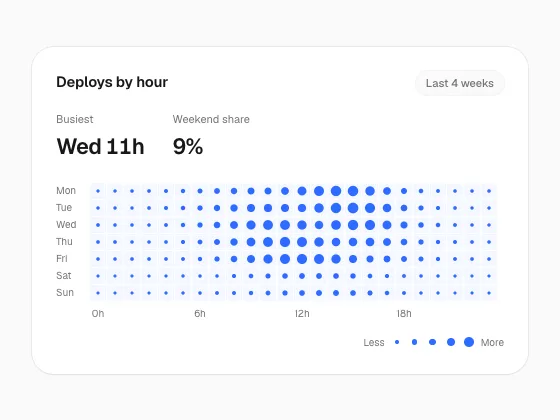
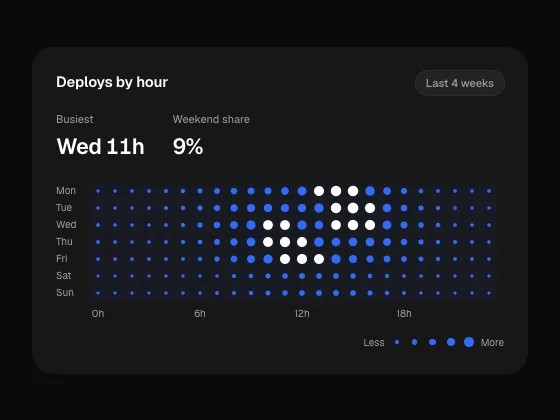
Sparkle Heatmap
ChartA grid shaded by value that cascades in diagonally, with a row-and-column crosshair on hover — an electrified dot grid with twinkling four-point sparks.
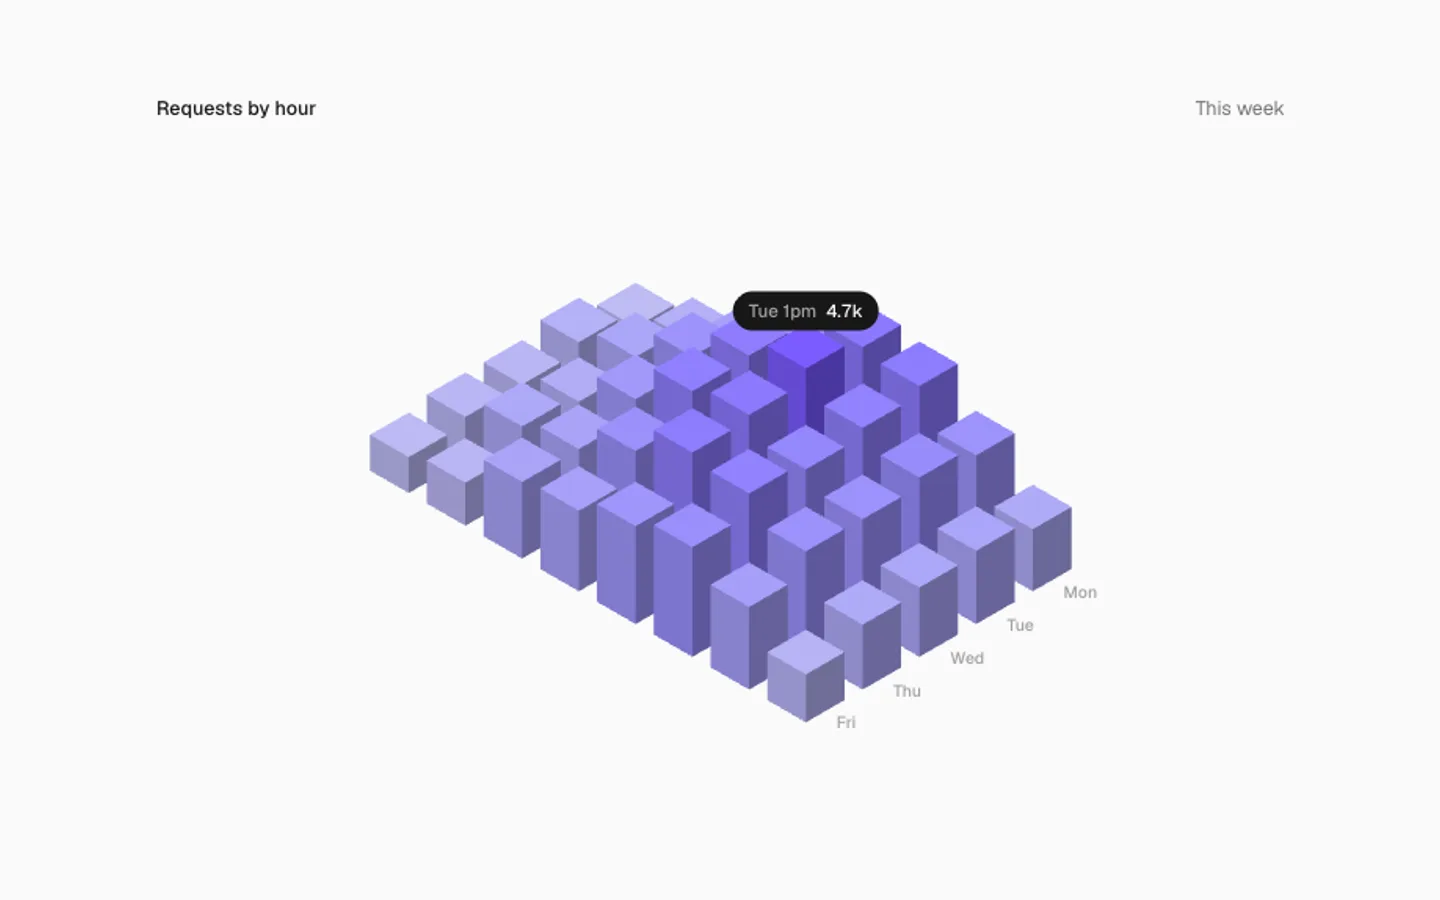
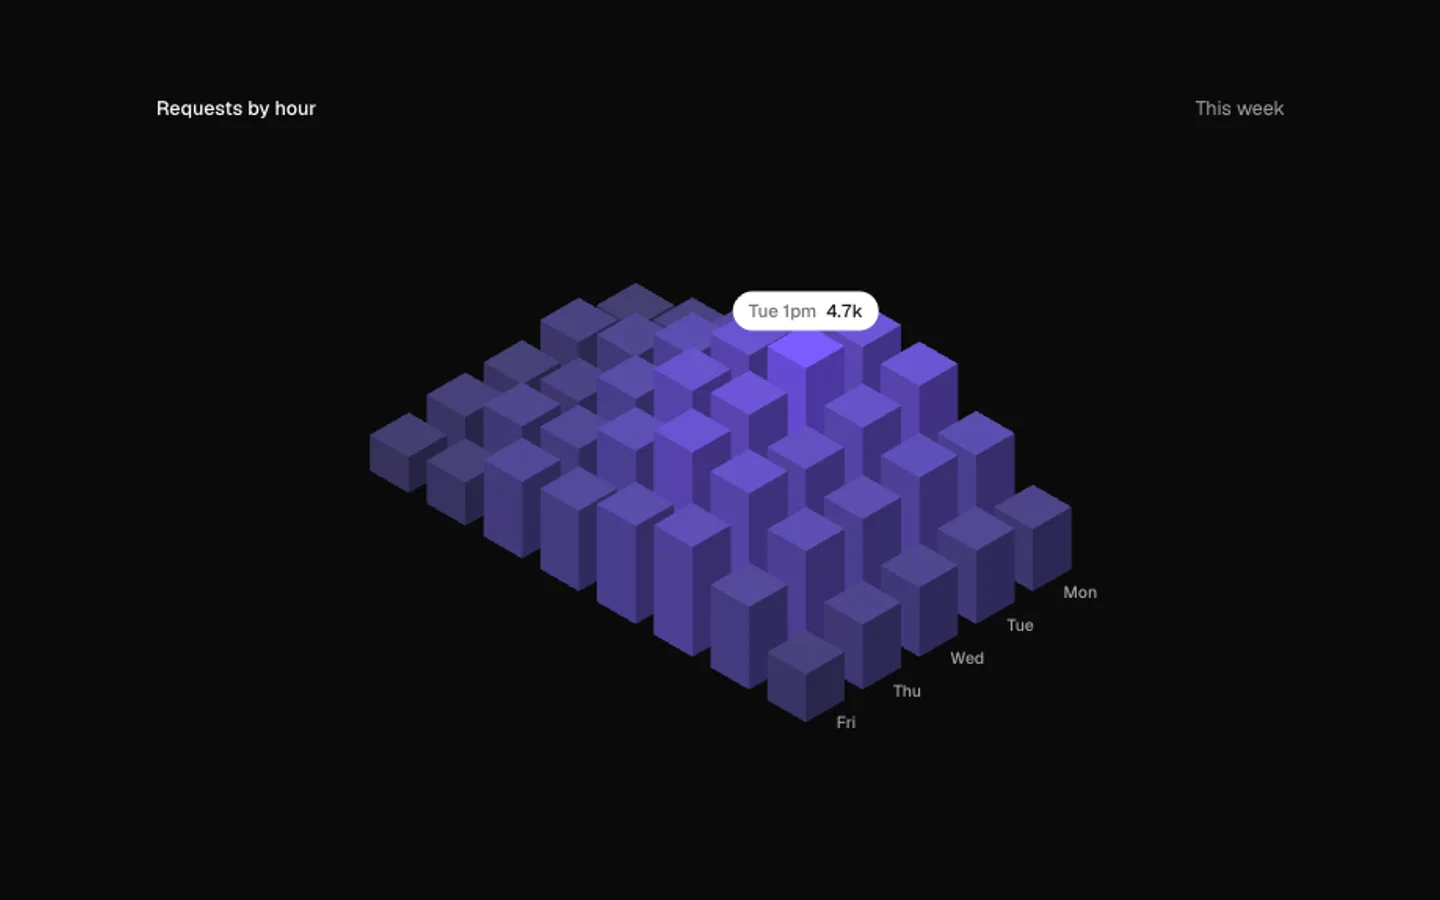
Bar City
SectionAn isometric city of bars, one block per value. Blocks spring up in a wave on view, then new data rolls in and every block springs to its new height. Point at a block to read it.
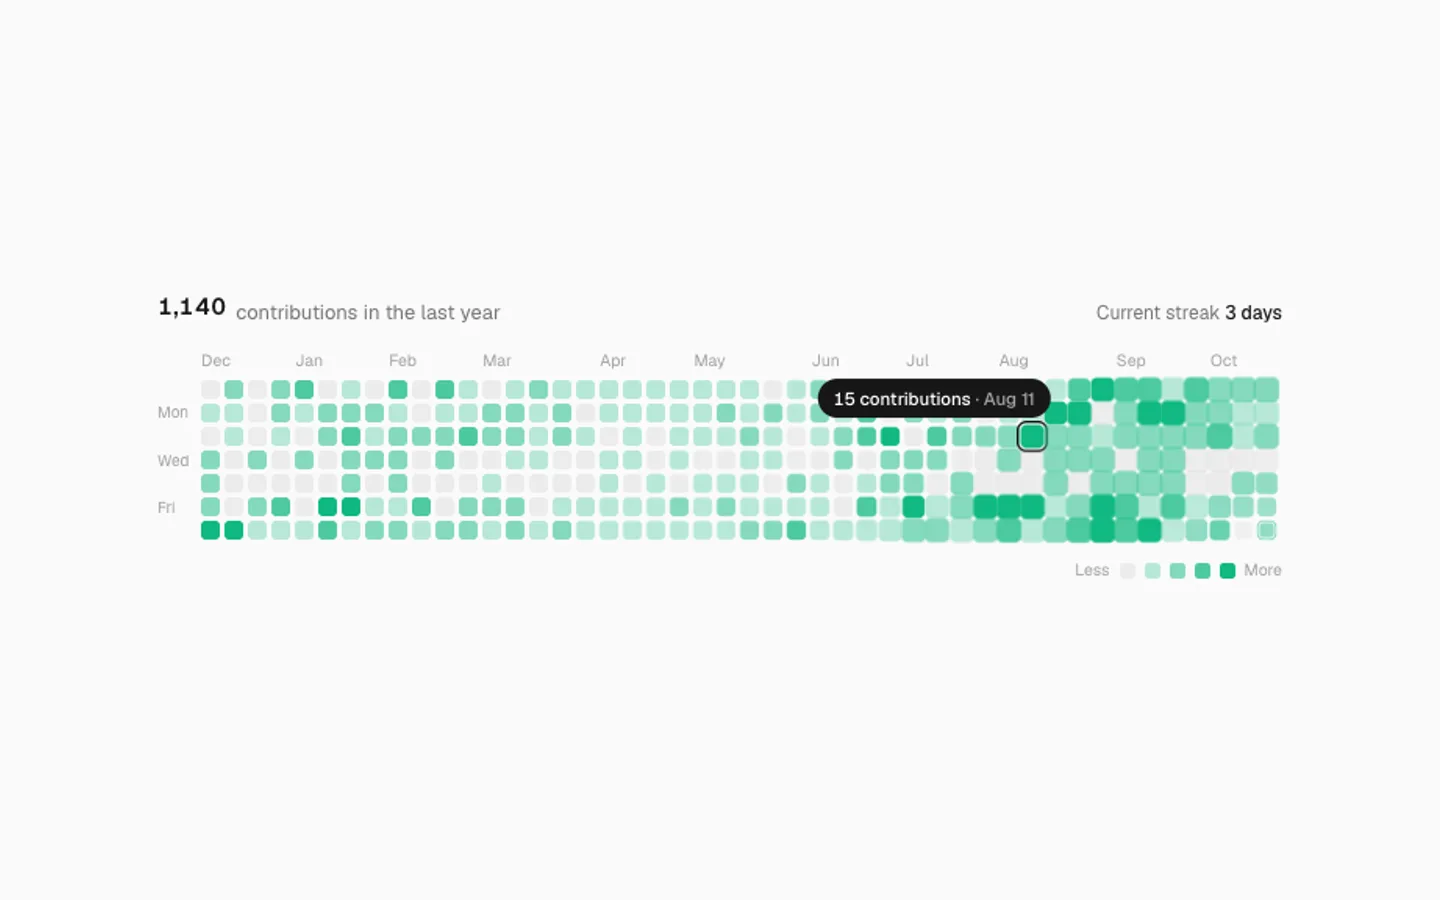
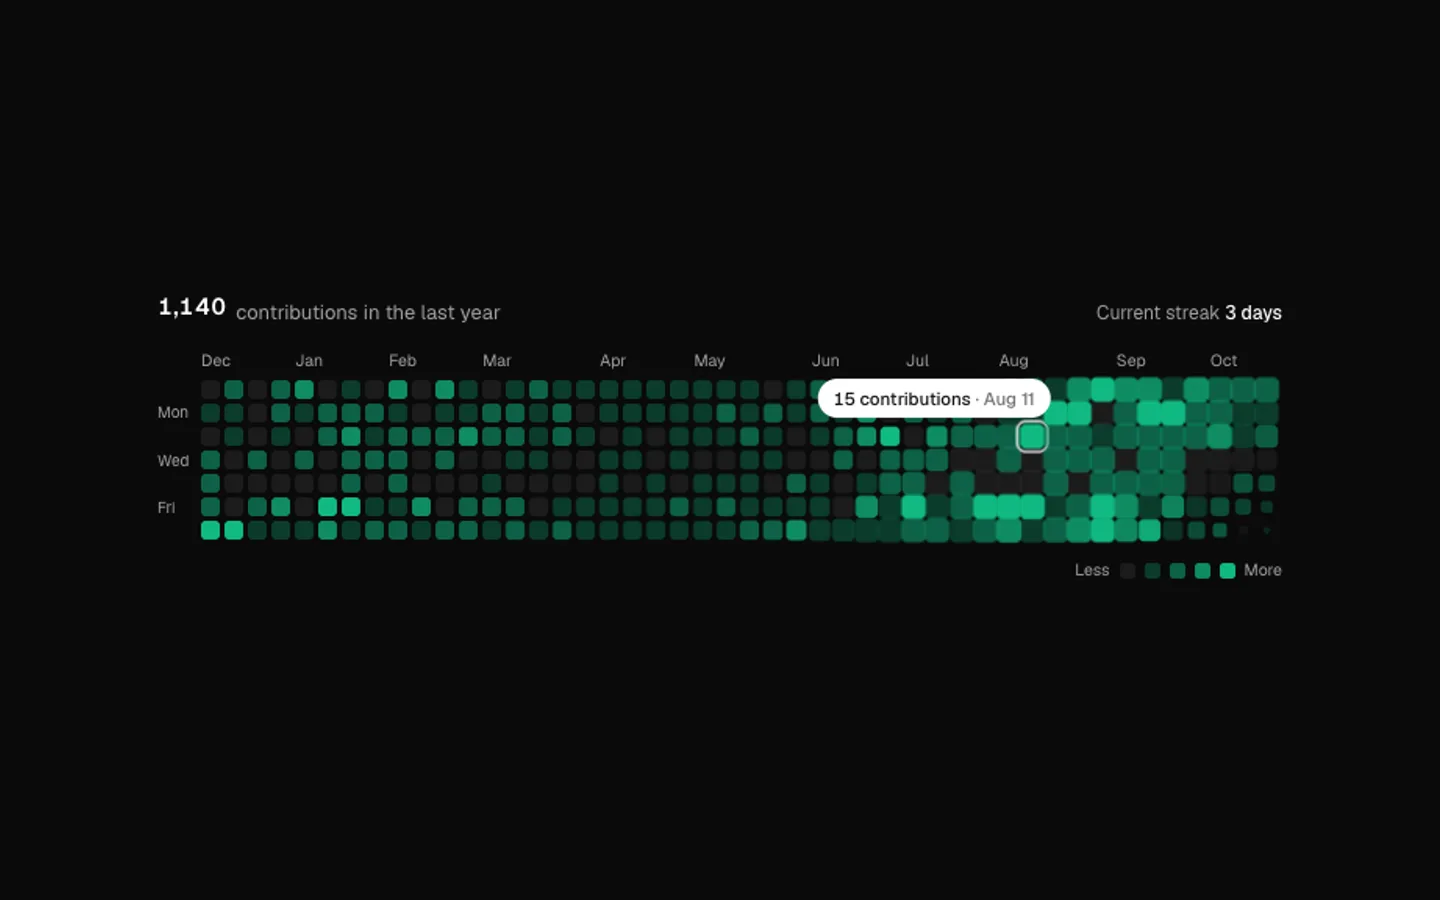
Contribution Heatmap
SectionA year of activity as a grid of days. Weeks pop in from left to right on view, today keeps ticking up and the total rolls. Point at any day to read it; left alone it visits the busiest days.
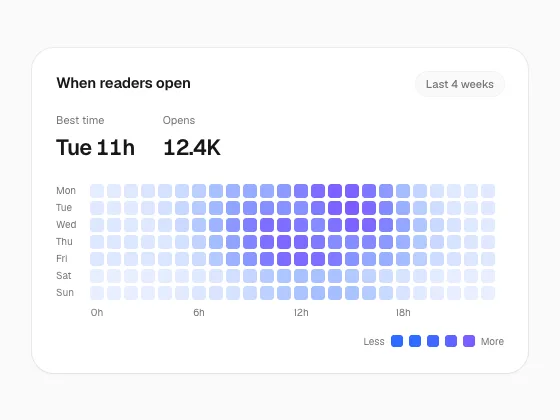
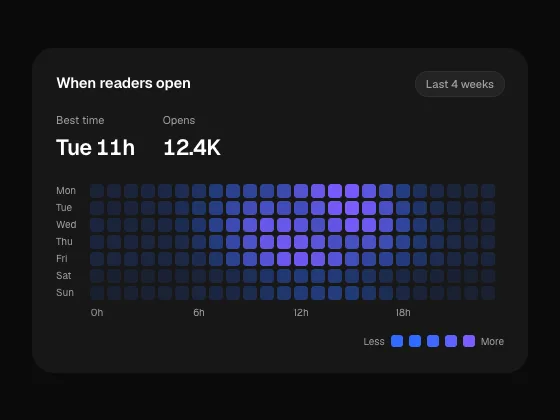
Gradient Heatmap
ChartA grid shaded by value that cascades in diagonally, with a row-and-column crosshair on hover — soft gradient fills that fade into the floor.